- Oct 30, 2019
When you read reviews of cubes you encounter lots of strange vocabulary that has been developed by cubers to describe concepts that don’t really exist outside of the cubing community.
Terms like buttery, crunchy, cripsy, blocky, bumpy, flimsy, and airy, (among others I’m sure!) describe the feeling of turning cube layers.
This is reminds me of the language that wine connoisseurs use to describe wine, where words describe sensations that don’t really make any sense except to people that have experienced those sensations many times.
But, I want to know if I can quantify these concepts. It seems like quantifying the sensation of turning a cube should be much easier than quantifying the flavor of wine.
My thinking is that if I can very precisely measure the amount of force required to turn a cube layer, then at least some of the descriptions of cube turning sensations should be identifiable in the resulting data. For example, a buttery turn should have a different looking force graph than a bumpy turn. I expect that I would be able to see greater friction in the bumpy turn, probably also greater variation in the friction as the cube turns. So, how do I test this?
My strategy is as follows:
Create a holder for a cube that allows the cube to freely rotate.
This holder will push on a load cell. (A load cell is a little electronic device that measures how much force is applied to it.)
After some amplification, the signal from the load cell is measured with an oscilloscope which essentially gives me a graph of force over time.
Then I just grab the top layer of the cube with my hand, give it a twist, and see what data I get!
So, I’ve done some initial tests with a crude cardboard model and a Qiyi Warrior, and it looks like this technique might actually be capable of producing interesting results!
In the video below, a cardboard cube holder is supported on an axle that can rotate. The corner the cardboard cube holder pushes on a load cell. When I rotate the top layer of the cube the friction between layers transmits some of this force to the cardboard holder and then to the load cell for measurement. The harder it is to rotate the cube, the greater the force on the load cell.
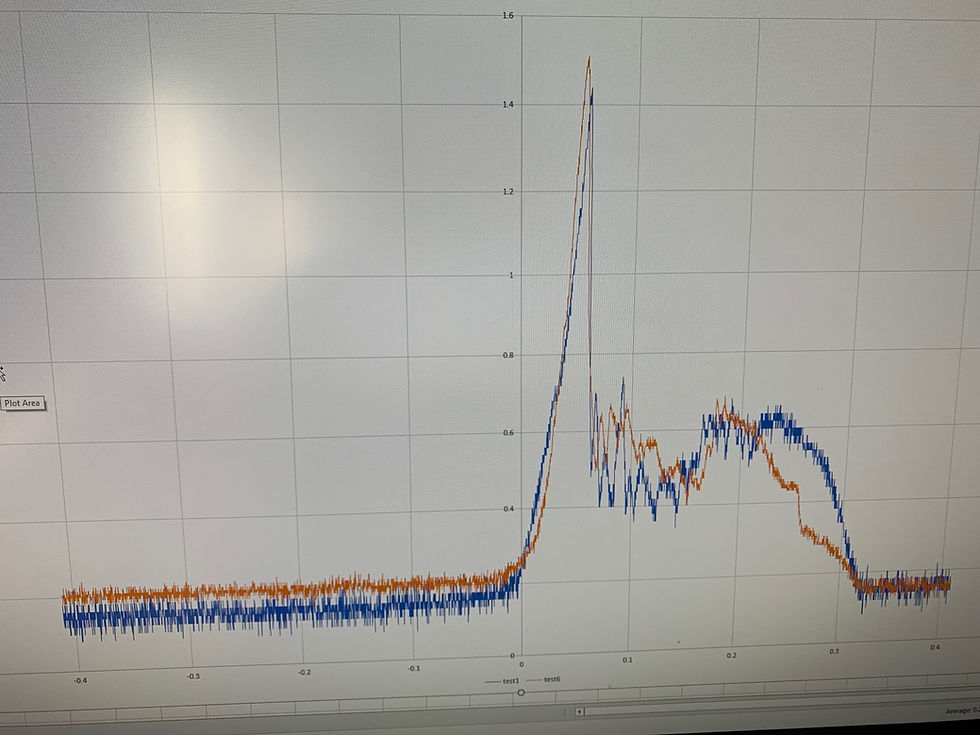
Below is a graph based on data saved from my oscilloscope. You can see the high initial torque required to overcome static friction, and then once the layer is turning the torque sharply drops to a lower torque.

Even though I’m just turning things by hand I’m getting very nicely repeatable results. Ultimately I think I’ll need to turn the cube in a more precise way so that every turn is exactly the same. I’ll probably do this with some kind of servo motor. This way I’ll be able to compare the torque graphs for two different cubes turned at exactly the same rate.
Stay tuned for more updates soon!
Load cell: https://www.sparkfun.com/products/14727
Amplifier: http://www.ti.com/product/INA125
Oscilloscope: https://www.sparkfun.com/products/retired/10806


